IPA Expands Capability to Benchmark Wind Farm Projects
Power companies are boosting investments in renewable energy capacity, including capital spending on wind power generation projects. Several factors are driving the uptick in power industry investments in renewable energy sources—industry tax incentives, clean energy policies, and the demands of a growing number of companies to run their operations on renewable power sources.In some countries, the potential for greater energy independence is responsible for increased wind power investments.
Opportunities to build or acquire renewable wind power assets are offset by cost risk. The costs associated with purchasing turbines and building the infrastructure to connect these assets to the main grids can be high, especially in a regulated environment. Demand for renewable energy, such as wind power, is growing and incentives for building onshore and offshore wind farms are making these projects more economical, but put simply—these projects have to be cost competitive for their owner companies. Power companies must be well-attuned to the capital effectiveness of their projects.
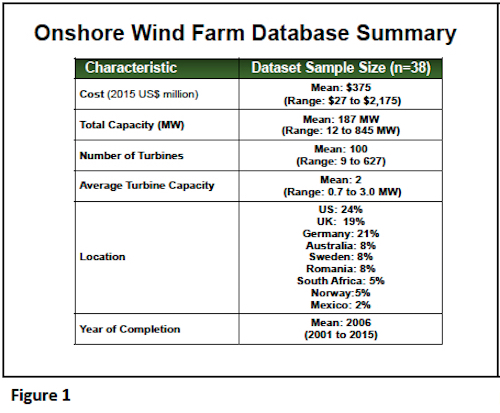
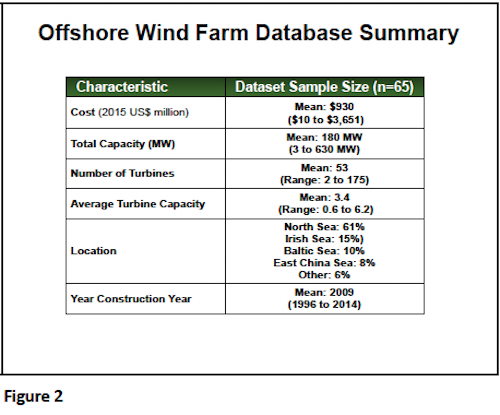
Building on its experience helping power companies improve the cost performance of their capital systems and projects, Independent Project Analysis (IPA) Inc., is expanding its capital project benchmarking capability to include benchmarking wind power projects. Out of a database of more than 500 power projects, IPA maintains a separate database of more than 100 onshore and offshore wind projects combined with costs ranging from $10 million to over $3.0 billion. Located globally, the average capacity of these projects is 187 megawatts for onshore wind projects and 180 megawatts for offshore projects. Summaries of IPA’s onshore and offshore wind datasets appear in Figures 1 and 2. The wide range of projects enables IPA to benchmark many different wind farm projects.
The Project Benchmarking Process
Take, for example, a wind farm in the North Sea, near Denmark. The project team wants to compare their project with other similar projects. The process begins with IPA meeting with the project team to clearly understand the scope of the project, the challenges the team faced, planned and actual cost and schedule results. The face-to-face meeting is necessary to ensure understanding of the project, alignment of definitions, units of measure, common project milestones, etc. In this example, the project has a capacity of 200 MW. The wind farm site—turbines, electrical substations, and supporting structures—are built in 20 feet of water. The estimated total project cost was $900 million and the actual project cost was $939 million, reflecting an overrun of only 4 percent.
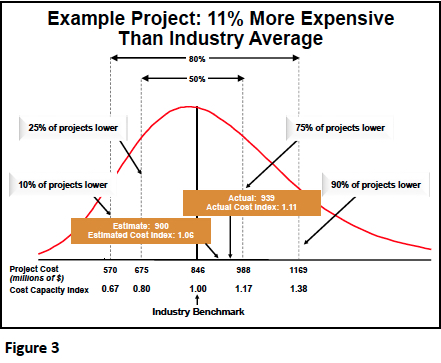
From a project cost perspective, the extensive database and statistical tools provide the method for making meaningful comparisons. Figure 3 summarizes the cost performance of the project compared to other similar projects. The figure reflects a frequency distribution of project costs. As shown, 50 percent of projects of similar size and scope would cost between $675 and $988 million and 80 percent of projects would cost between $570 and $1,169 million. The industry average cost for a similar project is $846 million. The project was estimated to cost $900 million, which was 6 percent more expensive than the industry average cost of $846 million. Unexpected weather conditions extended the aggressive project schedule and contributed to a 4 percent cost overrun. The project final cost was $939 million, which was 11 percent more expensive than industry average. This example demonstrates for one metric (cost performance) how benchmarking helps teams understand their competitive position and areas where they may need to improve.
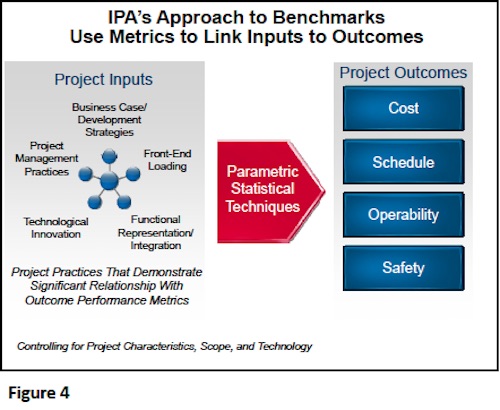
Figure 4 summarizes the typical metrics IPA uses in comparing or benchmarking capital projects.
Visit IPA’s Energy (Oil & Gas, Power & Carbon Efficiency) page for additional information.