Project Office Costs: The Right Mindset
More people fear flying than driving because, with the media giving much more attention to airline crashes, we tend to overstate the risks of flying and understate the risks of driving. The mind’s availability bias is our tendency to base judgment on information that is readily available or the easiest for us to retrieve. This common decision-making bias is also replicated in the project and business environments in the project industry.
Consider that during the hot market (2003 though 2009), owner costs 1 grew significantly to 25 percent above the 2003 baseline, while after the global financial crisis, owner costs promptly fell back in line with pre-market conditions. Many may interpret that as a recovery indicator linking project office cost variations to market conditions. Others may also use their total project office cost to gauge the effectiveness of their project capital spending during different periods also defined by market conditions.
At first glance, this seems to be a logical way of thinking, since the owner project office costs seem to be a function of many factors affected by market conditions such as wages, staffing levels, and project types. But this idea could also be misleading, as well as dangerous, especially when it becomes a convenient “rule” affecting decision makers’ understanding of project risk and risk sharing with contractors. This idea can actually be thwarted in two important ways:
Owner Spending Alone Does Not Explain Total Project Cost Performance
As shown in Exhibit 1, we found, through our historical data,2 that contractor office costs in changing markets tend to mirror owner costs, which suggests that when the market is hot and contractors are stretched through reducing staff and/or shifting work to engineering value centers (EVCs), owners responded by increasing their staff to compensate. While this interpretation might explain the variations of owner office costs over a given period and given market conditions, it certainly does not explain the total office cost variation that makes a company’s own office spending alone a misleading indicator of what’s driving its capital projects’ cost performance.
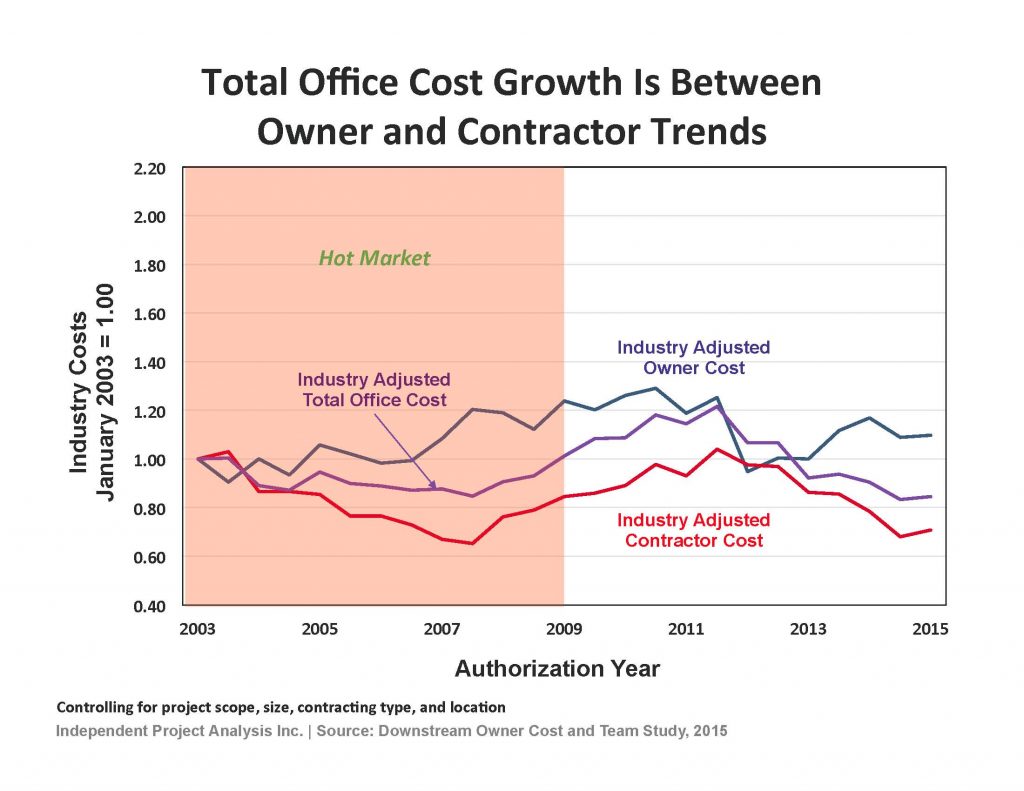
Exhibit 1
Project Practices Do Matter
When examining profiles of the project industry’s Best Performers,3 we found that, given a set of these projects comparable to the rest of Industry in terms of size and complexity, location, contracting strategies, and project type, the difference in project costs and schedules is primarily explained in terms of project drivers4 and execution practices. For instance, Best Performers carry Best Practical FEL 5 into execution and ensure team stability, which helps them get through execution with minimized risk
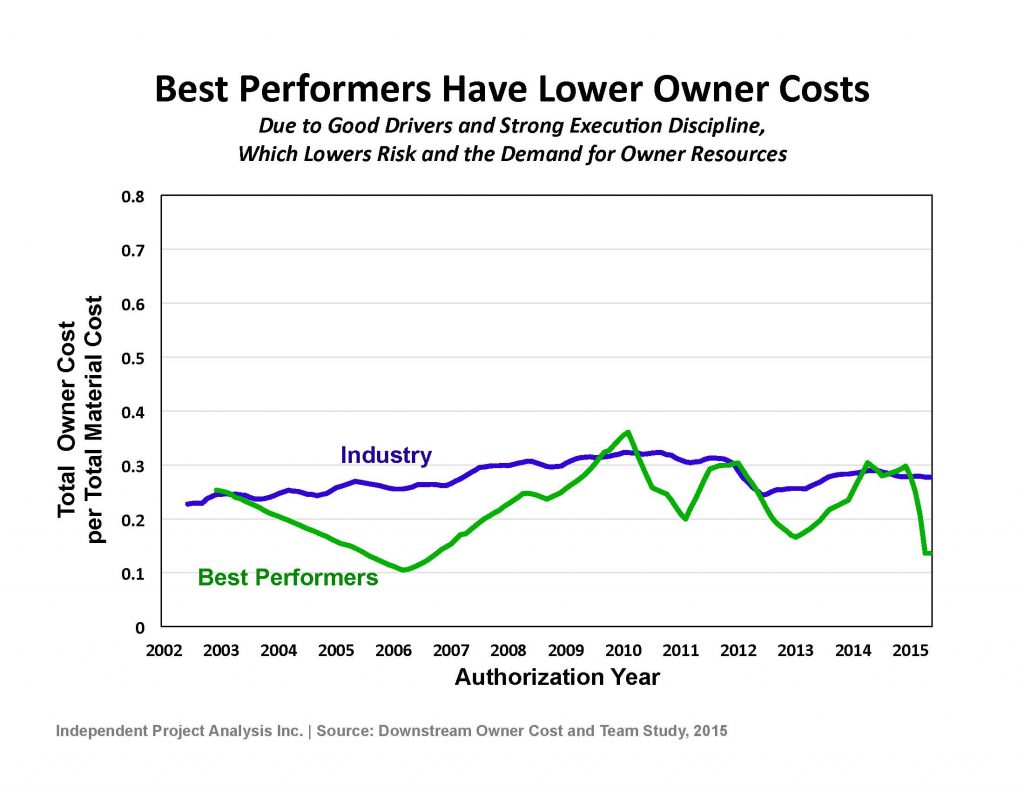
Exhibit 2
Additionally, aside from practices, project characteristics largely determine which owner staffing strategy is appropriate to achieve success. Project characteristics include project size and type, choice of contracting approach, using EVCs, and ability to leverage site-based project management groups.
Value-minded business and project executives know that the recipe for success is also anchored in achieving cost competiveness. That starts with a thorough understanding of the company’s spending, including assessing project office cost effectiveness while characterizing time trends compared to Industry. In an increasingly resource constrained project environment, a valuable debate for owner teams would be to examine the structure and effectiveness of their project office costs. Companies could benefit from this kind of analysis to help them identify opportunities for leaner and more robust teams capable of delivering business value and making the most of an ever-changing market.
Related Articles
- The Hidden Costs of Our Contracting Choices – Inside the Industry Contracting Strategies for Capital Projects
- Despite Risks, Industrial Projects in Emerging Markets Can Be Competitive
1 Downstream Projects’ Owner costs are a subset of the project total office cost, which also includes the contractor office cost.
2 IPA’s downstream owner study database is composed of 1384 projects with an average size of 2015US$420 million. The average authorization year is 2007.
3 Best Performers are projects that achieve both actual cost effectiveness index ≤1.00 and actual execution schedule indices ≤1.15
4 A project driver is a project element characterizing the project definition phase (pre-execution) that is proved to be statistically correlated with project outcomes such as safety, cost, and schedule. IPA’s proprietary framework for capital projects evaluation is composed of a number of measurable drivers such as Front-End Loading (FEL), Team Development, and Value Improving Practices.
5 FEL is a project driver with significant statistical correlation to project outcomes used by IPA clients to assess their project risk, also used as a framework for improving project definition, thus increasing the likelihood of project success.
Contributors: Ron Auld, Neal Banks, Lucas Milrod, Alex Ogilvie, and Andras Marton
This article is the first of a series depicting several aspects of the downstream project office costs. Data used were extracted from IPA’s Downstream Project Office Cost Study, performed for an IPA client. The study characterized time trends in the client and industry downstream owners costs and staffing, showed where the client was comparable to or different from Industry, and identified links to overall project outcomes and opportunities for the client to improve its project performance through owner staffing strategies.