Industry Norms for Sustaining Capital Allocation to Sites
Data to Put an End to the Rising and Waning, Fighting and Complaining
One of the biggest conflicts Independent Project Analysis (IPA) observes at manufacturing companies occurs during the annual capital allocation process, in which sites and corporate or business units battle it out to see who will receive the biggest chunk of available sustaining capital (SC). By sustaining capital, I mean “stay-in-business” capital — the money that sites will use to maintain their production and make minor improvements to existing assets. Although this sounds like it could be a straightforward number to determine based on the site’s needs, the process can be quite contentious. Moreover, it is often driven by corporate finance requirements (e.g., “spend should be 60 percent of depreciation this year”), more so than by site requirements. As Figure 1 shows, a given manufacturing site typically wants to maximize its share of sustaining capital, to make improvements, eliminate process, safety, and environmental risks, and sustain production. Conversely, because sustaining capital projects are typically non-revenue-generating, the business or corporate arm usually prefers to minimize, or at least strenuously justify, sustaining capital spend.
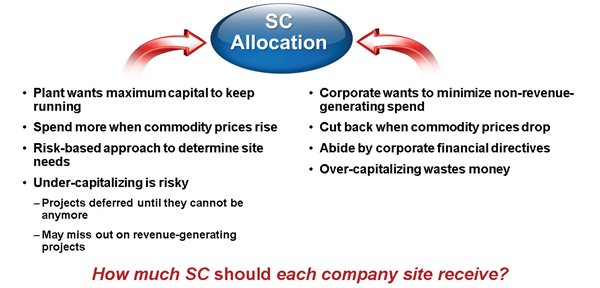
Figure 1. Competing Forces Surround Sustaining Capital Allocation
Although benchmarks for maintenance expenditure are often readily available, some industries seem to lack robust benchmarks for sustaining capital. Without comparative data, companies face several major risks:
- Knee-jerk reactions to commodity price changes—when prices drop, companies that respond too dramatically risk cutting back investment to the point where it negatively affects safety, environmental performance, and uptime. When prices rise, they risk over-investing relative to the long-term market outlook.
- Letting corporate politics or personal relationships dominate the discussion—for example, allocating a disproportional share of capital to the site where the facility manager is the “squeaky wheel”—the most aggressive in making the case for more capital.
- Without good data to allocate capital year after year, sites are often on the receiving end of large swings in allocation. As an example, it is not unheard of for a site to receive $50 million in sustaining capital one year, then $100 million the next, and $75 million the year after. Although sometimes such swings are legitimate due to shutdowns or major investments, they can often be driven by finance objectives and the whims of the allocation process. As any site knows, it is very difficult to manage capital in the face of such ups and downs—it is quite challenging to initiate or slow down projects to fit the desired cash flow, and to staff up and down rapidly. Likewise, it is frustrating for the business, which may see that the site is unable to complete as many projects as requested.
- Not being able to quantify how the company’s allocation practices are enhancing or impeding effective sustaining capital project execution. For example, some systems have quite restrictive “use it or lose it” approaches to annual capital allocation, which can be very disruptive to good execution. A common pitfall is that at the end of the fi nancial year, projects are rushed into the field to accelerate spend, without adequate project planning.
In short, a better, more quantitative way to allocate capital to operating facilities can help ensure that facilities are able to sustain production for the long term, while reducing unnecessary swings in capital spend. So how can a site or company understand what’s “normal” or how their sustaining capital investment level stacks up against competitors? Last year IPA worked with five global mineral operators to answer this question. We collected data from 50 sites around the world, covering the past 10 years of sustaining capital history, to reflect the high and low of the most recent commodity price cycle. The data came from a diverse set of sites, including different commodities, locations, and sizes, as shown in Figure 2.
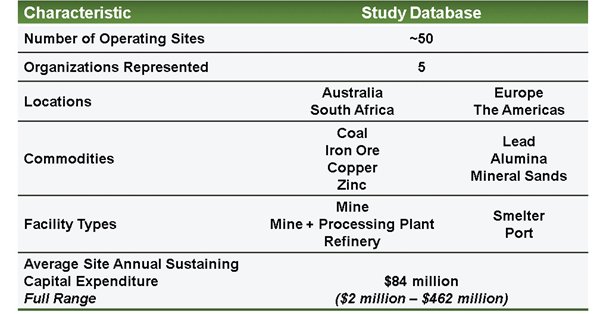
Figure 2. Sustaining Capital Study Included Diverse Mining/Minerals/Metals Sites
Given the diversity of sites in the study, it would be nonsensical to compare absolute capital spend (e.g., to say that Site A spends $50 million and Site B spends $30 million), without taking into account differences in production throughput, complexity, location, age, and other factors. To account for such factors, we studied a range of variables and identified the most robust ratios that can be applied to fairly compare sustaining capital investment across different sites. The key ratios are shown in Figure 3.
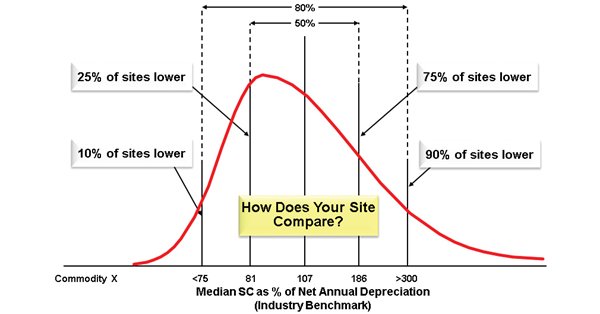 Figure 3. Sustaining Capital Investment Metrics
These are all important, and quite useful, measures:
Throughput
SC $/ton is a straightforward metric that can be used to easily compare sites of different sizes within the same commodity, using one of the most important measures of site performance— production. This is also the most robust metric we identified, with sites tending to fall quite close to the group average.
Financial Measures
Financial measures are frequently used by the business as the primary guide for capital allocation—for example, we commonly hear that the business will allocate a site the equivalent of (or no more than) its annual depreciation. Although on average this may be the case, our study revealed significant variability (as shown in the example graphic below). Most sites add considerably to their cost basis in some years. Likewise, sustaining capital spend relative to gross book value is another commonly used metric. However, whereas other literature sometimes cites that sustaining capital should be only a few percentage points of gross book value, our study found that for certain types of facilities, it is often 8 percent or higher.
Maintenance Expenditure
Examining sustaining capital expenditure relative to maintenance expenditure helps us understand if lowering spend in one area leads to a correspondingly higher spend in the other area, or vice versa—whether these expenditure categories interact and are traded off against one another. The study showed that these categories actually act together—they follow the same up and down pattern driven by commodity prices, although maintenance expenditure shows much less year-to year variability than sustaining capital.
Project Staffing
Sustaining capital per project manager is a critical metric because capital cannot be delivered effectively without the right staffing—if project managers are carrying too high a workload, they are unlikely to deliver the total capital spend effectively. A workload of $5 million to $10 million in total capital per project manager was common in our study.
As part of the study, we developed metrics by commodity (e.g, Sustaining Capital $/ton for copper sites) and by facility type (e.g., Sustaining Capital $/Project Manager for integrated mine and process facility sites). Figure 4 provides an example of how data were presented in the study.
Figure 4. SC Expenditure as % of Depreciation
Our discussions with participating companies show that these data are highly valued for several reasons:
- They allow companies to easily compare their investment levels with those of their major competitors, and at a glance discern whether their facilities are under-capitalized or overcapitalized. This can help justify a correction in spend where needed.
- They give companies a basis for better forecasting their sustaining capital needs in the near future. For example, coal prices reached a peak several years ago but have begun to decline. Should the decline continue, how drastically can coal sites afford to cut back on sustaining capital investment? Our data show that coal sites have enjoyed several years of above-average sustaining capital project investment, which means that (as much as sites may not like this result), the next few years can likely withstand fairly substantial cutbacks.
- Finally, relying on industry benchmarks helps remove the emotion from the allocation process.
The Sustaining Capital for Mining / Minerals / Metals sites study remains open to new participants. Further, IPA is developing similar studies to benchmark sustaining capital levels for other industries, such as LNG, pharmaceuticals, and chemicals. Visit IPA’s Site & Sustaining Capital page, for more information.
This article originally appeared in the IPA Newsletter 2014-Q3 (Volume 6, Issue 3). Visit here for additional information, the newsletter archive, and to subscribe for free.