Alberta Capital Projects’ Improvement Signals Its Emergence From the Lost Projects Decade
Over the past 10 or so years, the province of Alberta has become a safer place to work, cost effectiveness has improved, and project schedules are faster. This finding stands in sharp contrast to the findings of a 2008 IPA study in which IPA Founder and CEO Ed Merrow looked at 10 years of projects done in Alberta, Canada (1998 to 2008) and pronounced it the “Lost Projects Decade” based on the region’s very poor project outcomes. More recently, IPA looked at this region again and found something very different. Based on the performance of 684 Alberta projects over the past decade (2010 to 2020), we can now say that Alberta no longer lags the U.S. Gulf Coast in project competitiveness.
The key to this success cannot be attributed to drastic changes in the project marketplace. Instead, these improvements in project performance are correlated with improvements in project fundamentals:
- Clarity of project objectives
- More projects with integrated teams
- Improvements in the quality of front-end engineering and design (FEED) packages
- Improvements in project execution discipline
Project Performance Improvement Metrics
The Alberta project data are very clear on performance over the past 10 years across the three core project outcomes of safety, cost, and schedule. Alberta project field safety data have been improving for the better part of 20 years (although the curve has been flattening somewhat over the most recent years). Total recordable incident rates per 200,000 field hours worked show the steepest improvements, while DART[1] rates per 200,000 field hours show more modest improvement. IPA has seen similar improvements over time in the global industry safety data.
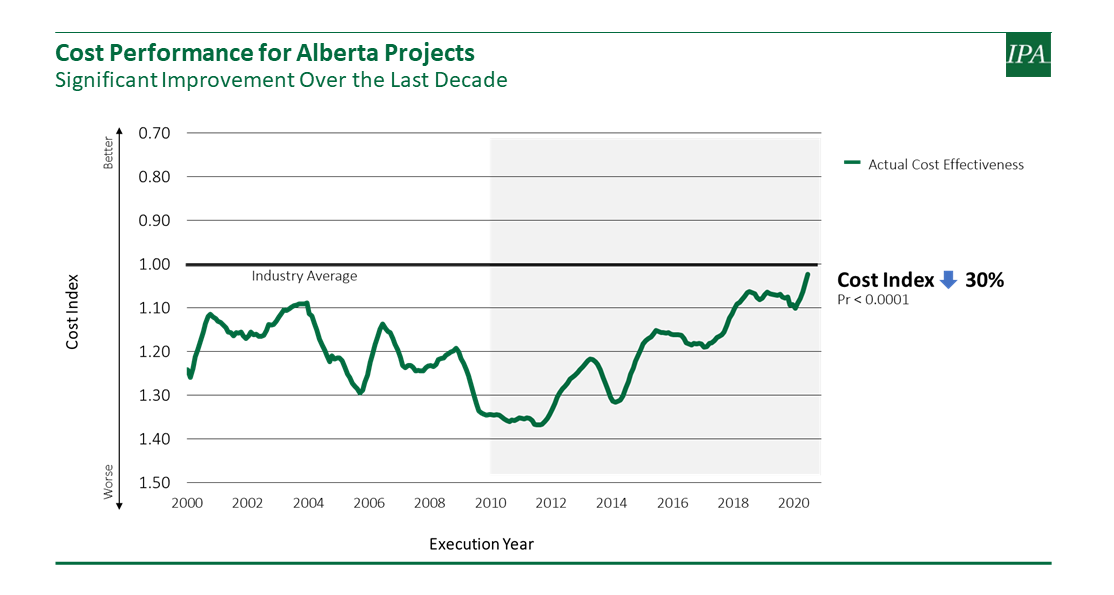
Improvements in cost performance have not been quite as steady as safety, as shown in the cost index time trend graphic above. Since about the year 2010, Alberta projects have shown a slow and steady improvement trend in project cost performance resulting in a 30 percent average cost index improvement from 2010 to present. Not only did costs improve during this time period, but projects also got faster! The average Alberta project construction duration is now comparable to global industry norms. Similarly, the average execution[2] duration got faster over the years and is now only about 10 percent slower than industry norms. All of these cost, schedule, and safety improvements are correlated with improvements in project fundamentals over this same time period.
Trends That Supported Improvement
Some interesting trends likely contributed to this cost improvement: fewer projects are schedule driven, more projects are using modular construction, and use of split form contracting strategies is more prevalent. Projects that drive schedule knowingly (or unknowingly) are trading cost in the name of project speed. Being schedule driven often makes projects more difficult to execute and usually does not make sense for commodity projects. Modular construction, on the other hand, transfers labor from the field to a more controlled work environment and can yield more competitive cost results in a harsh construction environment like Alberta. Over the same decade of observed cost performance improvement, fewer projects were schedule driven and more projects used modular construction.
Additionally, around the year 2011, IPA observed a shift in projects to more split form[3] contracting approaches. Prior to 2011, IPA observed more projects utilizing various types of EPC contracting approaches, the most popular being the EPCm approach. IPA’s research into contracting strategies has concluded that the split form approach tends to result in better project outcomes, including better cost performance.
Lastly, a reckoning (of sorts) occurred among some of the oil companies after the oil price crash of mid‑2014 to early 2016. A “lower for longer” mentality set in and companies responded with cost cutting efforts like mergers and headcount reductions, but also with a genuine interest in capital cost competitiveness. This interest from corporate leadership also contributed to the improved cost performance over the past decade. However, as described below, the contributions of these factors to the improved project outcomes were likely meager in comparison to the contribution of improved project fundamentals.
The Power of Project Fundamentals
Project success starts with clearly defined, documented, and understood project objectives and trade-offs. In Alberta, projects with clear objectives have less cost growth (-2 percent vs. 15 percent) and fewer design/scope changes. This is the first step toward improved project performance. Project teams are more easily integrated when working toward a common, well-understood objective. In fact, in Alberta, project teams that have all core stakeholders represented prior to full sanction have less cost growth (‑1 percent vs. 12 percent) and less schedule slip (17 percent vs. 28 percent). Since 2009, a higher percentage of Alberta projects have a clear understanding of the project objectives AND there is a higher prevalence of integrated teams. Additionally, over this same time period, Alberta projects improved the quality of their FEED packages. This includes having a better defined and detailed, quantity-based project estimate at sanction. These improvements in project fundamentals undoubtedly drove the improvements in project performance.
But it wasn’t just the fundamentals prior to project sanction that improved; Alberta projects also had better execution discipline over the past decade. Project controls improved and fewer projects turned over the project manager and construction manager. All of this improvement in project fundamentals also drove a strong time trend decrease in the incidence of major scope and design changes.
Conclusions
IPA’s data could not be clearer: Alberta project performance has improved over the past 10 years in safety, cost, and schedule performance. It is improvement in the project fundamentals that drove this success. However, the race is not over. Continuous improvement is just that—continuous. The journey is never over. Alberta, as a region, has seemingly recovered from past flaws and is now achieving (mostly) industry average project performance.
Please complete the form below to request more information on this study.
[1] DART stands for a safety incident that resulted in Days Away from work, Restricted work, or job Transfer. A DART is a more serious safety incident.
[2] Execution includes detailed engineering and construction duration.
[3] Split form contracting means that the engineering and procurement aspects were contractually separated from the construction contract.