Cost and Schedule Risk Analysis: Current State and Opportunities
A majority of industry (large) capital projects use a cost and schedule risk analysis to estimate the amount of cost and schedule contingency needed to center the base estimates and deterministic schedule. IPA defines cost contingency as an amount added to an estimate to allow for items, conditions, or events for which the state, occurrence, or effect is uncertain and that experience shows will likely result, in aggregate, in additional costs. It is meant to cover inadequacies in complete project scope definition, estimating methods, and estimating data. Contingency excludes scope changes, extraordinary events (e.g., strikes and disasters), management reserves, and escalation/currency effects. Essentially, contingency funds are expected to be spent during the project, but the project team is not sure what item will consume the cost in actuality. Similarly, for schedule, most large projects conduct a Monte Carlo schedule risk analysis, which is an AACEI Recommended Practice[1], and traditionally accepted to be Best Practice for schedule target setting. IPA research[2] has shown that while most owner companies expect a ±10 percent accuracy for their authorization estimates prepared at the end of FEL 3, Industry has, on average, observed a -17/+42 percent accuracy on their completed projects; that is, 80 percent of completed projects had cost growth between -17 and +42 percent from their planned cost estimate (including contingency) at the end of FEL 3. Similarly, if we look at capital projects with costs greater than $10 million (2022US$) that were completed over the past decade, 80 percent of those projects observed schedule slip between -4 and +55 percent.
Risk Analysis Challenges
IPA has seen significant variability in the level of maturity across owner companies in terms of implementation of these cost and schedule risk analysis Best Practices. For example, we see project teams conduct purely qualitative risk analysis on schedule, basic quantitative analysis that includes the traditional activity range estimating, modern quantitative analysis that includes risk drivers specified by probability and effect and assigned to all activities they affect, and finally the advanced integrated cost‑schedule risk analysis.
Getting any of these methods to work is hard. For example, one of the challenges in getting a Monte Carlo schedule analysis to work is estimating correlations between activity durations in an effective fashion. Similarly, Monte Carlo-based methods for cost contingency setting fail because, while they focus on individual cost element distributions, cost estimates overrun because the scope was not all defined and not because the distribution around the individual elements was incorrect. Most industry projects use fabricated distributions, which are not based on historically observed and unbiased distributions of outcomes. Additionally, these analyses assume orthogonality of the distributions, which denies the reality of projects that most things are intimately connected.
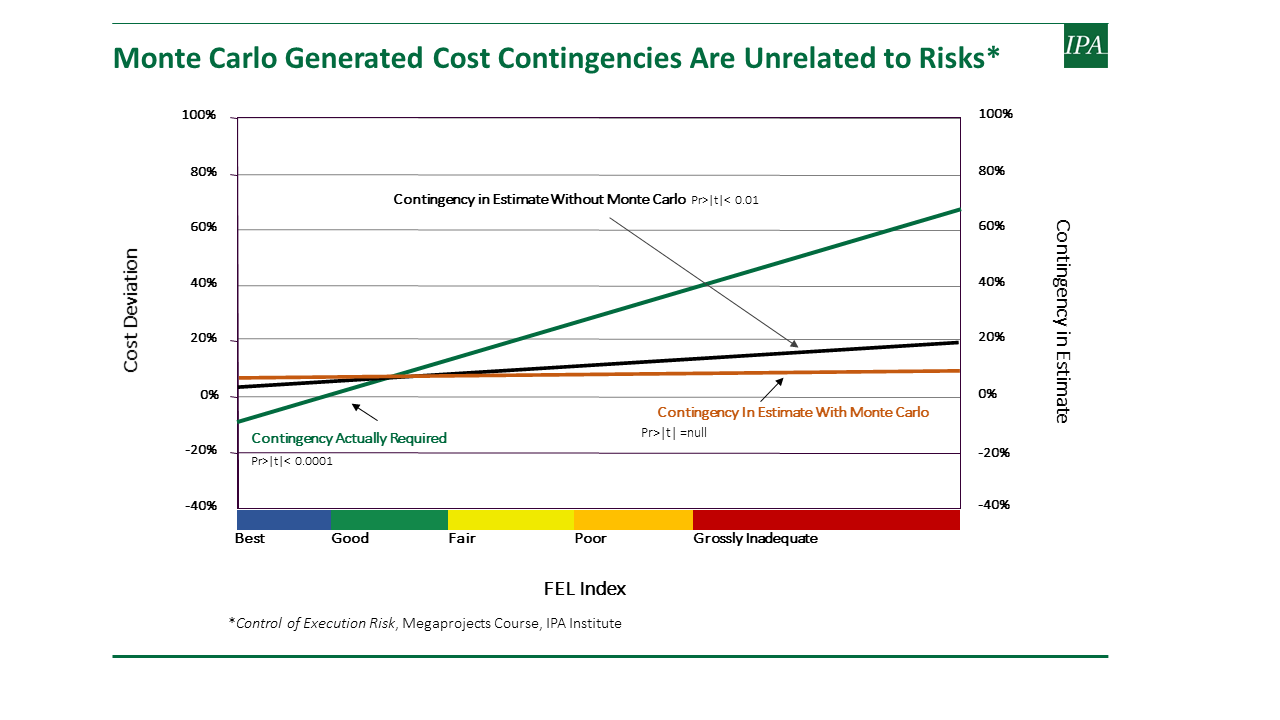
We find that 57 percent of large projects (>2022US$20 million) authorized over the past decade used a schedule risk analysis to set their schedule targets at the end of FEL 3, while around 60 percent used a Monte Carlo simulation method to set the cost contingency. For small projects (<$20 million), we find that the schedule risk analysis use drops to 22 percent, while Monte Carlo cost simulation drops to 37 percent. Despite the wide use of these practices for large projects, we have not seen Industry extract significant benefits in terms of improving their cost and schedule predictability. As shown in the figure below, is that Monte Carlo-generated cost contingencies are unrelated to risks. As shown in the figure, based on IPA data, we find that projects observe significantly larger cost growth and consume higher amounts of contingency at completion as the project definition level (as measured by IPA’s Front-End Loading (FEL) Index) worsens. However, whether the project used a Monte Carlo Simulation or not, we see no differences in the amount of contingency included in project estimates at authorization across the spectrum of project definition.
IPA’s Cost & Schedule Risk Analysis (CSRA)
Irrespective of the method used, AACE has recommended applying parametric methods to historical project data to identify the effects of systemic risks like scope definition, quality of the schedule/cost estimate, project controls, team integration, and so forth to validate the results of the cost and schedule risk analyses. To address this need, IPA has launched a new product, the Cost & Schedule Risk Analysis (CSRA), to help Industry leverage past project performance to quantify the inherent uncertainty in cost and schedule targets and identify the level of cost and schedule contingency required to center project targets at the desired level of tolerance for cost growth and schedule slip (e.g., the cost and schedule contingencies required for a 50 percent chance of underrun [P50] or 80 percent chance of underrun [P80] estimate).
IPA’s CSRA assesses the effects of systemic and project-specific risks in determining the optimal contingency requirements for cost and schedule. The project systemic risks are the artifacts of the strengths and weaknesses of a project system and planning and definition work during a capital project’s FEL phase. As part of the CSRA evaluation, IPA develops quantified measures of the clarity of business objectives, quality of project definition work, team composition and integration, and the competitiveness of the base cost and deterministic schedule targets at authorization, which have been established over the years by IPA research conducted on thousands of completed projects, as the greatest source of uncertainty on project outcomes. The CSRA also incorporates residual project‑specific risks, which are dependent on the conditions and events specific to a project location, scope, and strategy, such as risks of bad weather, labor shortages, long‑lead equipment delivery delays, and new technology problems.
Based on our findings, we recommend owner companies leverage their internal cost and schedule databases and develop parametric risk quantification methods of their own to bring some level of empiricism in their cost and schedule risk analysis and use the findings to validate their traditional risk quantification methods.
Contact us if you are interested in learning more about how IPA can help with risk quantification exercises.
[1] AACE International Recommended Practice 64R-11: CPM schedule risk modeling and analysis.
[2] Melissa Matthews, Quality of Cost Estimates, IBC 2018, IPA, March 2018.