Finding Efficiencies Early Is Key for E&P Developments
The Exploration & Production Industry is well on its way to exhausting the low hanging fruit of cost cutting—staff reductions, training and travel budget restrictions, supplier and service discounts, etc. But, at the end of the day, these approaches will not move the needle enough on cost savings. To survive and even thrive we need sustainable savings—not just short term cuts. Efficiency gains may be the most obvious, albeit overlooked, place to find such savings. The biggest efficiency gains, however, lie not in execution but in design efficiency, or “lean scoping.” As its name suggests, lean scoping is about scope efficiency or competitive scoping, i.e., streamlining scope to only what is necessary. To illustrate this idea, consider the two development options—Strategy 1 and Strategy 2—depicted in Figure 1, below.
The curve for each strategy depicted in the figure represents production profiles for competing development strategies for the same reservoir. Strategy 1, the red curve, delivers a high production peak and a rapid decline. Strategy 2, in blue, delivers half the production rate in the early years with a more modest decline. The recoverable volumes, the area under each profile, are the same for both strategies, but the associated capital investments are not. The peak production strategy, what we’ll call high depletion intensity, requires more wells, a larger facility throughput, and perhaps larger pipelines too.
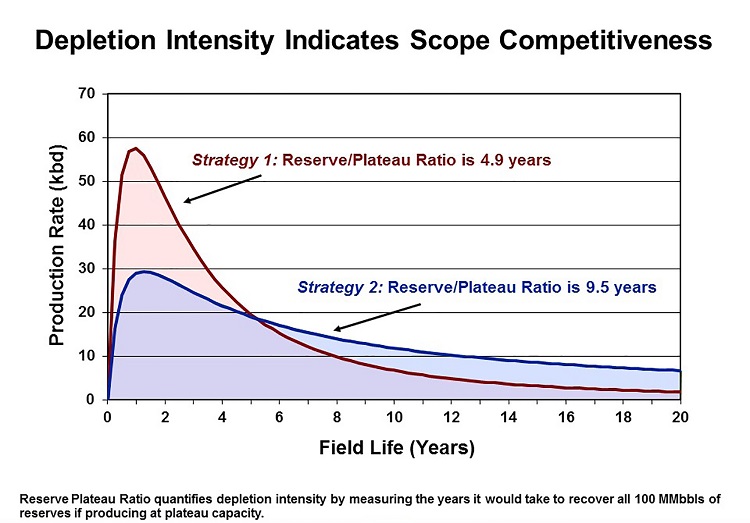
Figure 1
On its face, Strategy 1, the high rate/high investment scenario, seems less attractive. Why spend more money when you can recover the same barrels with less capital? But if we consider the present value of these two alternatives, Strategy 1 looks more attractive because the early production is much more valuable than later production, especially when commodity prices are high. This is exactly what we have seen over the past 15 years with high oil prices justifying oversizing facilities for higher depletion intensity (Figure 2). It is important to note that, while the marginal barrel maybe NPV positive, they are less capital efficient. Higher margins meant we ignored this fact, something we can’t afford going forward.
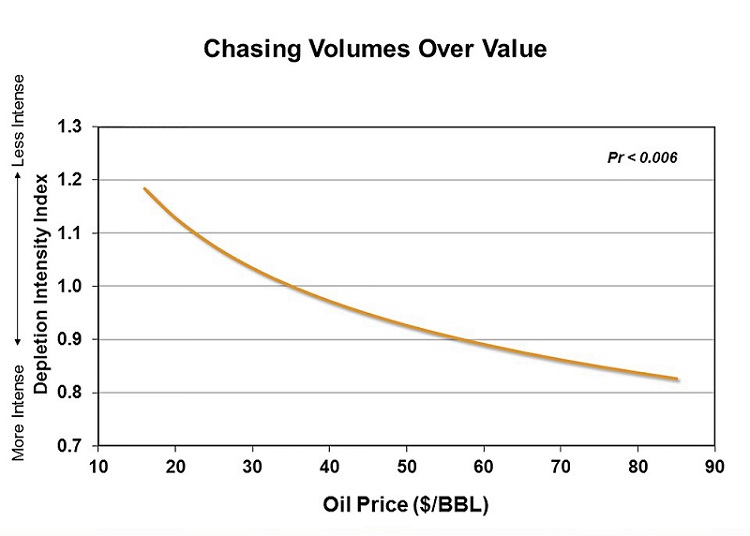
Figure 2
But now that we face a prolonged period of lower prices, Strategy 2 is the production rate curve we ought to chase. The trouble is that Industry needs to relearn how to be lean with scope. And the first thing we need to recognize is that lean scoping is not just a facilities exercise; it is a development mindset that asks: “What’s the most I can do with the least amount of investment?” “What is a minimum acceptable scope, rather than how big can I make this scope?” To answer these questions, we must first consider early depletion planning.
The depletion plan is arguably the most fundamental aspect of E&P developments. The plan dictates how many wells, what type of wells, and where the wells are located, etc. The gross recoverable volumes and production capacity depend on the depletion plan (and vice versa), and the depletion plan defines the basic contours of the facilities (again, vice versa). This interplay between reservoir, wells, and facilities makes depletion planning as much art as science, needing to balance a complex web of tradeoffs and competing objectives. IPA sees evidence of this in the sheer diversity of depletion plans for analog reservoirs.
Yet, despite the importance and the complexity of depletion planning, IPA sees far more tools supporting facility cost and schedule benchmarking. Cost and schedule metrics for wells are also prominent, but a $/ft metric tells you nothing about the efficiency of your depletion plan or your overall development strategy. The most common tool among reservoir engineers, the analog reservoir, is an excellent way to make this comparison; however, true analogs can be hard to find, especially in light of the number of highly influential parameters that need to be considered.
Scope Benchmarking Tools
To help address these shortcomings and support lean scoping efforts, IPA in collaboration with an owner firm, has developed “scope” benchmarking tools that define the industry average scope solution for a given set of inherent conditions (e.g., reservoir characteristics, location, and water depth, etc.). Our first such tool establishes development well count benchmarks.
Our development well count models provide customized industry average well count distribution based on reservoir and fluid characteristics such as size, permeability, viscosity, and pressure, etc. These benchmarks are not meant to provide “the answer” but rather should provide an additional perspective to help promote informed discussions between diverse functional engineers, managers, and decisions makers. These metrics should prompt users to ask “What explains my position along the industry distribution?” and “Am I comfortable with my well count vis-à-vis others?”
We, as an Industry, should give serious consideration to the notion that in order to make projects profitable at less than $50/bbl, we need to go beyond just asking for supplier discounts. We need to think hard about doing more with less. Finding efficiency gains early is key.
We look forward to hearing how you and your company are approaching this challenge and we want to share our experiences and case examples on how we, as an Industry, can become leaner and more profitable.