IPA Completes Early Estimating Metrics Tool for Pharmaceutical Capital Projects
In recent years, businesses in the life sciences industry have been pushing project teams to commit to cost targets early in Front-End Loading (FEL). Early estimates are generally prepared based on limited information and subsequently have wide accuracy ranges. Industry perceptions for FEL 1 and FEL 2 estimate accuracy are significantly more optimistic than IPA data support. The limited information in early project stages creates challenges for estimating, and lack of tools and databases adds more challenges. To help support our pharmaceutical industry clients overcome these challenges and improve their capital project conceptual estimating performance, IPA has developed a Pharmaceutical Projects Early Estimating Metrics Tool. The tool includes an entire suite of early estimating metrics for delivering various pharmaceutical facilities.
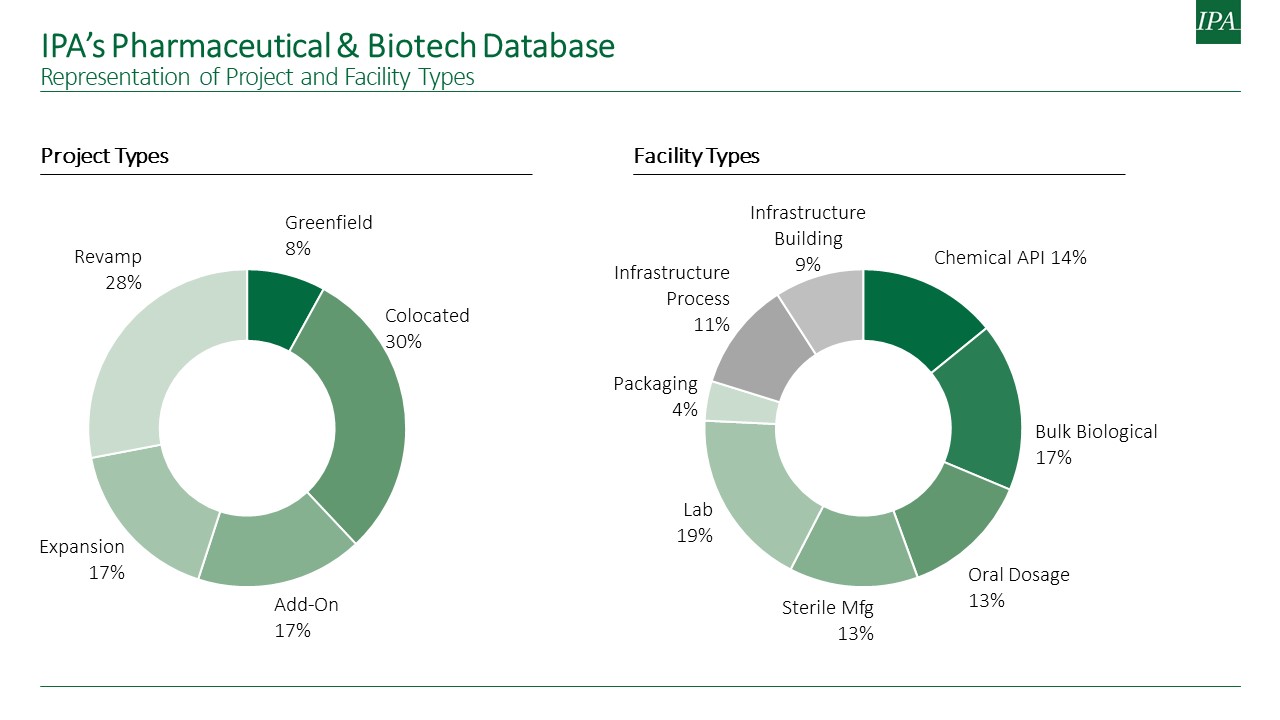
The metrics tool is the result of collaboration between IPA and our life sciences clients. Seven major life sciences companies teamed up to identify data that can empower project teams to improve the accuracy of conceptual project estimates and reliably validate detailed estimates. IPA’s pharmaceuticals and biotechnology sectors capital projects database serves as the core of the metrics tool. The database includes project development and execution data from over 900 projects located in North America, Europe, and Asia.
What Types of Life Sciences Metrics Are Included With the Tool?
To ensure creation of a complete set of early estimating metrics, IPA partnered with participating companies identified four key types of facilities as a starting point for the tool—bulk biological, sterile form/fill, laboratories, and chemical active pharmaceutical ingredient (API). Data on all project types, including greenfield (process unit costs only), colocated, and brownfield projects (i.e., add-on and expansion projects), were collected and supplemented by data already in the database to create the metrics tool. The projects represent the most current data in the industry, which are either recently authorized or completed within the past 5 years. The minimum project size for this data collection effort is US$10 million. Notably, a standard Code of Accounts (CoA) was also established, allowing for the continual collection of completed project data in the same format and the eventual expansion of the metrics datasets.
The following early estimating metrics are available to clients:
Cost to Cost Metrics
- Total Installed Costs (TIC) $ / Equipment $
- Office Costs $ / TIC $
- Process Automation $ / TIC $
- Building Automation $ / TIC $
- Process Installation (Labor & Materials) $ / Equipment $
- Commissioning & Qualification (C&Q) $ / Equipment $
Cost to Scope Metrics
- TIC $ / Square Foot
- Exterior Enclosure $ / Square Foot
- Direct $ / Square Foot
- Total Process Costs / Process Area
Scope to scope metrics
- Process Area Square Foot / Gross Square Foot
- Controlled Classified Square Foot / Gross Square Foot
Schedule Metrics
- Design Duration Through OQ Duration / TIC
- Phase Duration / Square Foot
The end product includes 40 cost and schedule metrics, with summary statistics provided for each metric. Each metric comparison such as mean, median, and interquartile ranges is also provided, along with graphs.
User Group Feedback
Participating owner companies have been using the metrics in the estimating and validation process and gave the tool high marks. Here are a few comments made by the current participants:
“We used the early estimating metrics at the feasibility stage for a large project and the information generated by the tool indicated specific areas of concern that needed to be challenged, like area metrics and schedule durations, that lead to a significant savings on both time and cost as we could contest engineering assumptions and ensure the project was fit for purpose.”
“Benchmarking cost and schedule with our Life Science peers is very important to gauge the effectiveness of our capital projects. The IPA tool is an easy to use, flexible platform that enables us to compare projects across key data elements in a standard, repeatable fashion allowing us to ask the right questions and help guide the correct business decision.”
“Our internal estimating practice is focused on conceptual estimating for option evaluations and estimate validation. Oftentimes, our own sample sizes per facility type are too small to derive meaningful metrics from them. In addition, we would like to understand how our estimates compare with industry benchmarks. Therefore, we are grateful that IPA has created a forum that allows us to share data and insights with peer companies without compromising confidentiality.”
IPA plans to keep the tool current through annual updates with new project data and industry trends that will be available to the tool subscribers. Participating owner companies will also get an opportunity to set direction for future tool expansion into new facility types and output metrics. Owner companies in the life sciences sector are still able to participate in the initiative to provide project teams with the data and capabilities they need to improve the effectiveness of the projects they are responsible for delivering.
Complete the form below to contact us and learn more.