Offshore Wind Supply Chain Headwinds in Store for the Sector
Offshore wind became the new bacon in 2020. Although capacity has grown significantly over the past decade (going from about 3GW up to near 30GW), it is a drop in the bucket compared to the forecast growth over just the next 5 years. Per the National Renewable Energy Laboratory (NREL), announced offshore wind projects amount to an increase of nearly 100 gigawatts of newly installed capacity by 2025. At an aggressive US$3,000 per kW, that is only about US$300 billion in capital investment in 5 years.
The demand, so far, is very real. Europe—the clear first mover in offshore wind (and other renewable energy sources)—made and drove significant policy changes over the last decade, requiring more energy to come from renewables. Europe has the majority of existing installations with many planned in the future.
Though arriving casually late to the party, much of the eastern United States has recently enacted its own policy changes to bring about more clean energy—particularly from offshore wind. On the U.S. East Coast alone, over 15 new projects are in development—the vast majority of which are in the early planning and permitting phases.
In addition, many in the energy sector (including major players from the oil and gas industry) have recognized that offshore wind is one of the quickest ways to green the grid and thus have added wind as a new pillar to their businesses as they focus on becoming carbon neutral.
With all this excitement, what could go wrong? Well, we have seen exponential investment cycles in the energy sector many times before, most recently between 2003 and the financial crisis (2009) and again between 2010 and 2014. Unfortunately, growth of this scale is typically associated with significant cost escalation and a greater frequency of project failure (major cost overruns and schedule delays, as well as operational failures) perpetuated by a stressed supply chain. This is especially true in markets that rely on highly specialized manufacturers and service providers—something offshore wind has in abundance. This view runs counter to the more popular opinion that offshore wind costs will continue to come down, but given past experience in other comparable industrial sectors, we believe there are still strong headwinds in store for offshore wind’s capital cost.
RELATED
Offshore Wind Industry Cost and Schedule Benchmarking
Designing the Capital Delivery Framework for Wind Energy
In Offshore Wind Auctions, CAPEX Knowledge Pays Off Big Time
The Ugly Step Sister
Though arguably the antithesis to offshore wind, the oil and gas industry bears an eerie resemblance when it comes to supply chain challenges. In fact, the two industries even share some of the same supply chain. This makes some of the recent history in oil and gas a good proxy for what we might expect in offshore wind in the coming years if the capacity growth lives up to the forecast.
To understand the similarities, consider the scope of an offshore wind farm. At a high level, it includes a few key components—turbines, subsea foundations, subsea power cables, and offshore and onshore substations. The figure below gives a nice visual.
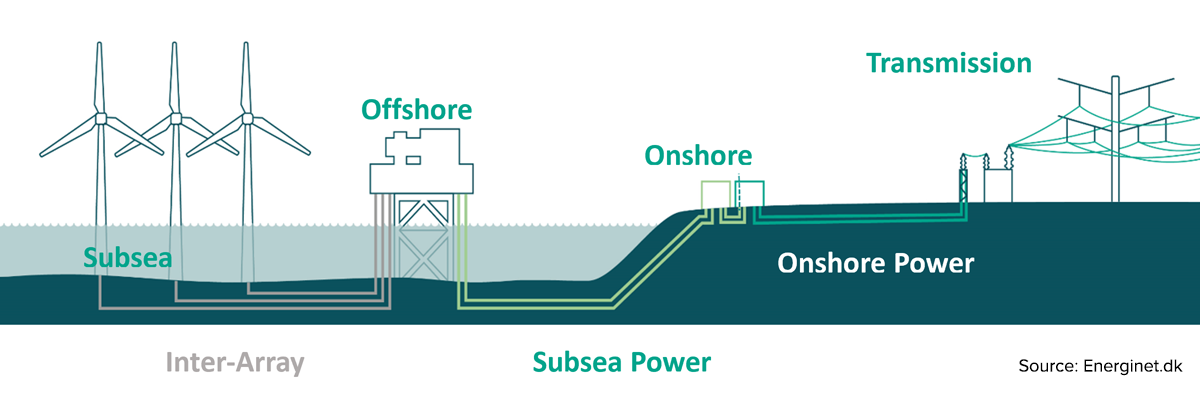
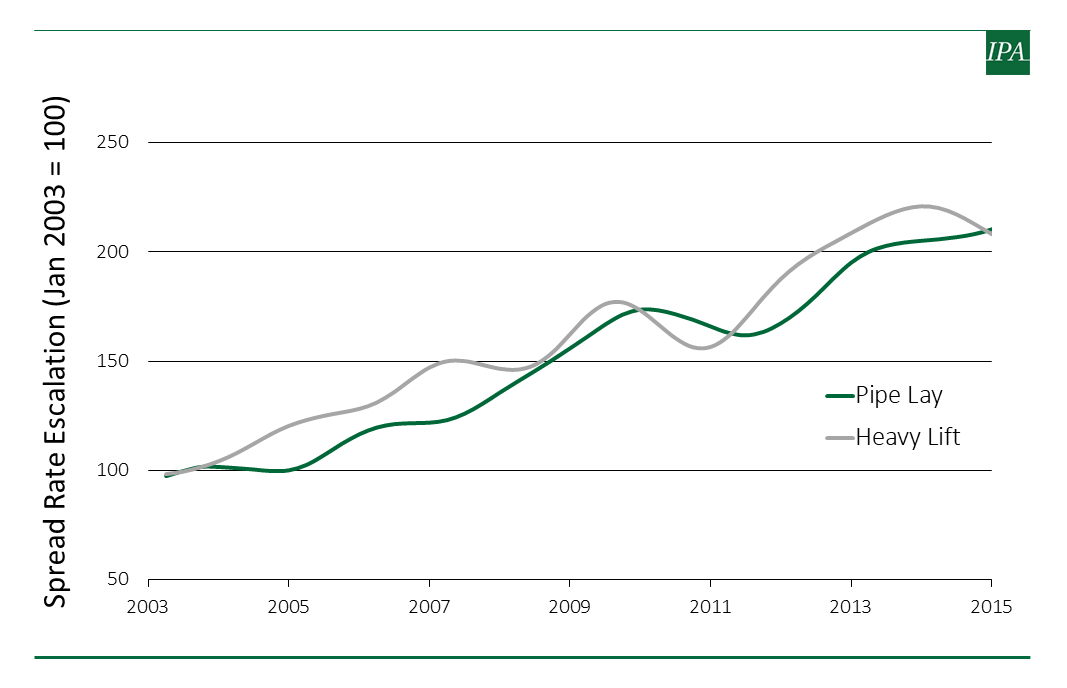
Except for the turbines, you can find a lot of the same scope in an offshore oil field. And that’s where the challenges come in. Unlike an onshore development, offshore construction is complex and highly specialized, resulting in a short list of players who can do it. This scarcity has continuously hampered oil and gas over the years. When oil prices are high, the heightened demand has driven near exponential increases in prices and lead times for offshore services. In the figure below, we show historic price escalation for offshore heavy lift (used to install offshore platforms) and marine pipe lay vessels through 2014, right before oil prices crashed. Prices more than doubled in about 10 years and the 2009 recession only slowed them down for a short period of time.[1]
At the Mercy of the OEMs
When you look at the players needed to fabricate, install, and connect offshore wind infrastructure, you find only a few names. For example, for turbines, which make up a good chunk of the capital costs for a wind farm (about 30 percent of the capital expenditure), there really are only three players—Vestas, Siemens Gamesa, and GE. This market concentration is similar to what we see in subsea gathering systems for oil and gas. Subsea gathering, or subsea for short, reflects the infrastructure (pipelines, cables, wellheads, etc.) needed to transport oil and gas from the subsea well to the processing facility. In addition to the direct analogs (subsea cables, foundations, etc.), the supply chains between offshore wind and subsea have many similarities.
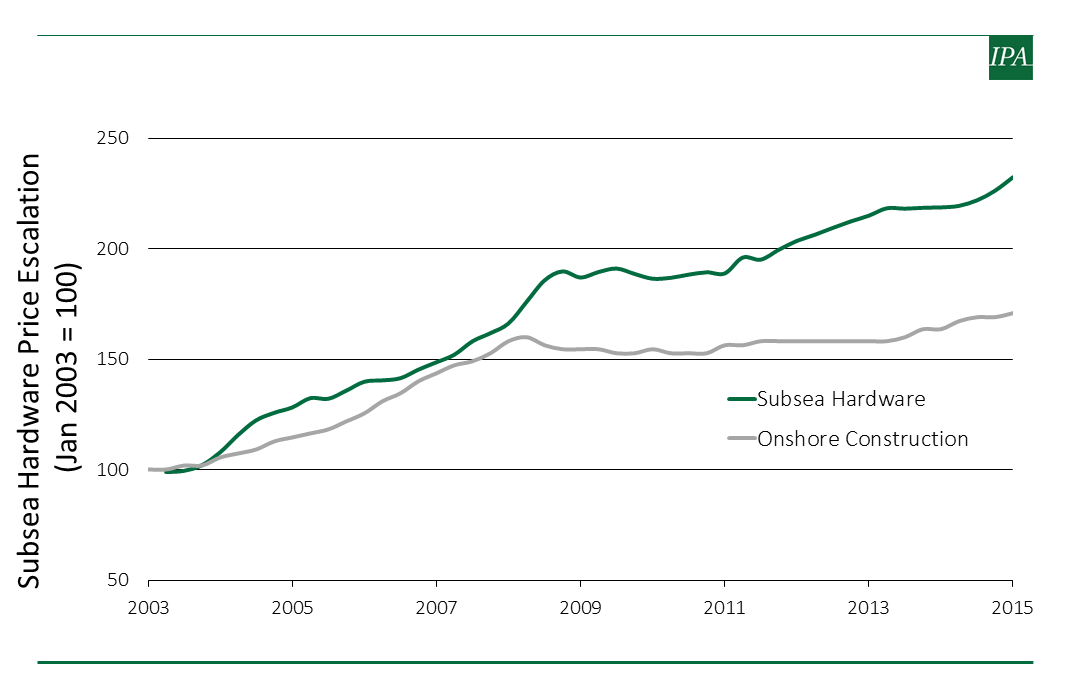
For example, consider subsea hardware. Subsea hardware consists primarily of manifolds and trees, which control and route the oil and gas production from the subsea wells. Like offshore wind, the vendor market for subsea hardware consists of just a couple players (today really only two—TechnipFMC and OneSubsea). When we look back at periods of high demand (high oil price), we see that as the orders for trees began piling up, the prices for trees more than doubled. Further, the lead-time for a tree went from a year to over 2 years. In the figure below, we show the subsea hardware price escalation over two hot market periods, 2004 to 2009 and 2011 to 2015. Onshore construction cost escalation is included in the figure as a reference.[2]
Although speculative, it would not be beyond imagination to expect that the costs for turbines—because of supply constraints—will experience a fair amount of price escalation given the rapid increase in demand. However, unlike oil and gas, offshore wind has a major mitigating factor working in its favor, at least so far as the turbines go. Over the past 10 years, turbine sizes in both megawatts and blade size have increased by over 50 percent, and projections have them increasing by roughly the same amount by 2025.[3]
Of course, the cost of the turbines will go up to accommodate the innovation and size increase, but this will be offset by the additional power generated by each turbine. Note, it will not be entirely offset because the bigger turbines require larger transport vessels, which are not cheap and just sitting around idle. As indicated above, the supply of offshore installation and support vessels is by no means vast. The same is true for heavy transport. When the market heats up, these services come at a premium.
When we examine the data, we see that both the field and turbine capacities have increased. The two characteristics are not perfectly correlated (because you could just install more turbines), but a lot of the overall increase can be attributed to the bigger turbines. In the figure below, we show turbine capacity over time using both completed and planned projects.[4]
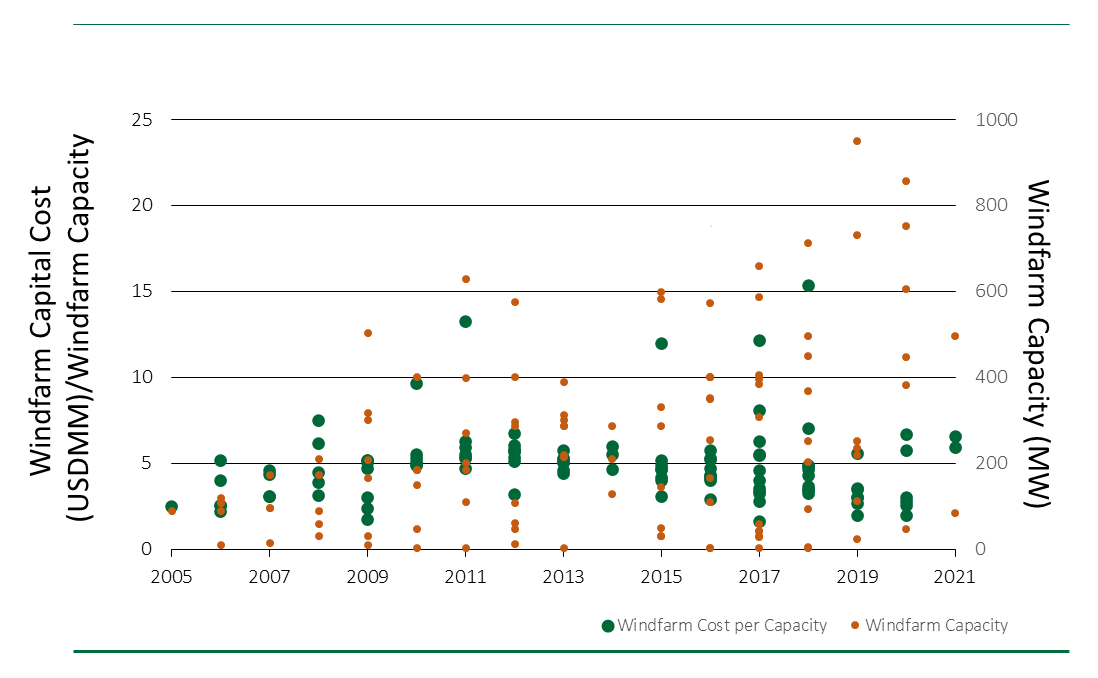
The data for completed projects do show that, as a result of these capacity increases, the overall cost to develop a wind farm has come down, which is entirely consistent with what we see in any industrial manufacturing setting. The bigger the plant, the lower the cost per unit output. This does not mean that the projects are cheaper—it just means you have to build bigger to lower the cost.
The next figure shows both windfarm capacity in megawatts (MW) and cost per MW over time.[5] The windfarm cost per capacity is shown on the first y-axis (in green) and windfarm capacity is shown on the second y-axis (in orange). The chart is a little busy, but the pattern is clear. As field capacities began to increase sharply around 2015, the cost per MW began to decrease.
This is an important nuance when thinking about windfarm capital costs. The cost savings are in the size and reflect pre-pandemic and pre-wind boom pricing. This does not mean that the projects are cheaper, and, given the economics, there is no reason to believe the turbine cost will do anything but increase.
Although the turbines make up a significant portion of the cost, they are not the only major cost or the only component subject to a tight market. The remaining balance of plant scope—substation topsides, jackets, subsea cables, and subsea installation—each has supplier limitations and can be expected to experience escalation over and above the 2 to 3 percent annual escalation seen in cooler markets (not to mention the sharp increase in commodity material costs, like steel, that we have seen coming out of the pandemic).
Offshore Constraints
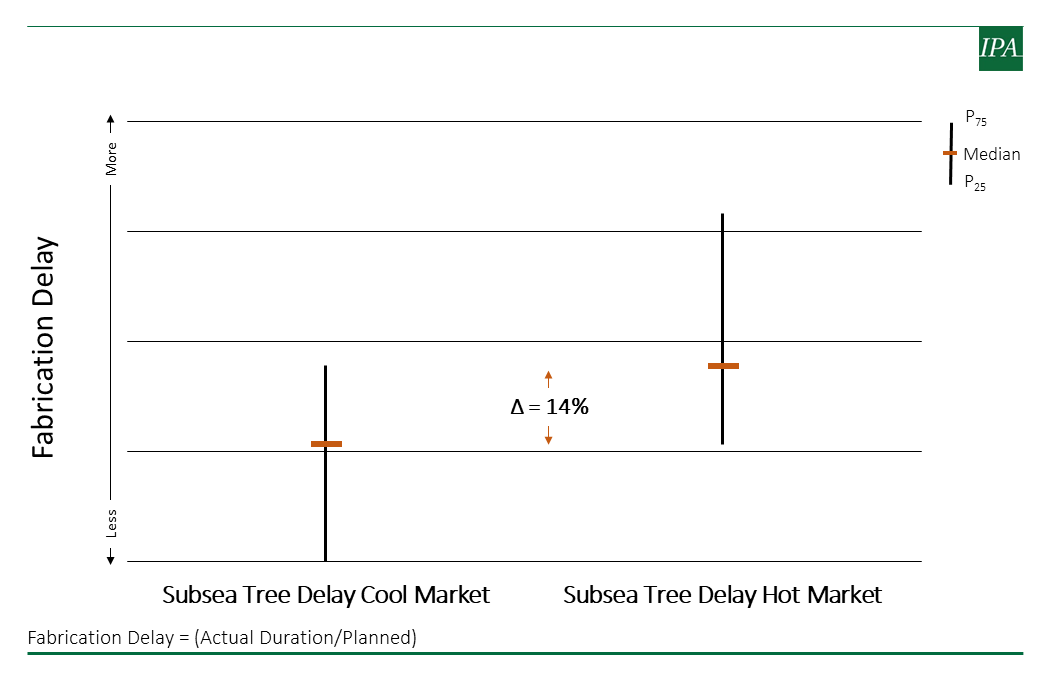
Schedule delay is another concern owners and project stakeholders need to consider when planning projects during periods of heightened activity. The same scarcity driving up prices also extends lead times for equipment, materials, and services. In the figure below, we contrast the delay (measured as the actual duration divided by the planned duration) for subsea trees between hot (2005 to 2015) and cold (<2005 or >2015) market periods.[6] In the hot market, nearly all durations were longer than planned, with many experiencing delays of over a year.
In offshore, where schedules are always tricky due to the environment and weather windows, fabrication slip can cause installation targets to be missed, delaying project completions by months and sometimes years. The constraint here is with the installation vessels that are booked out years in advance. When equipment and facilities (e.g., the substation topsides) fabrication is delayed, the project may lose its installation contractor who has to move on to the next job.
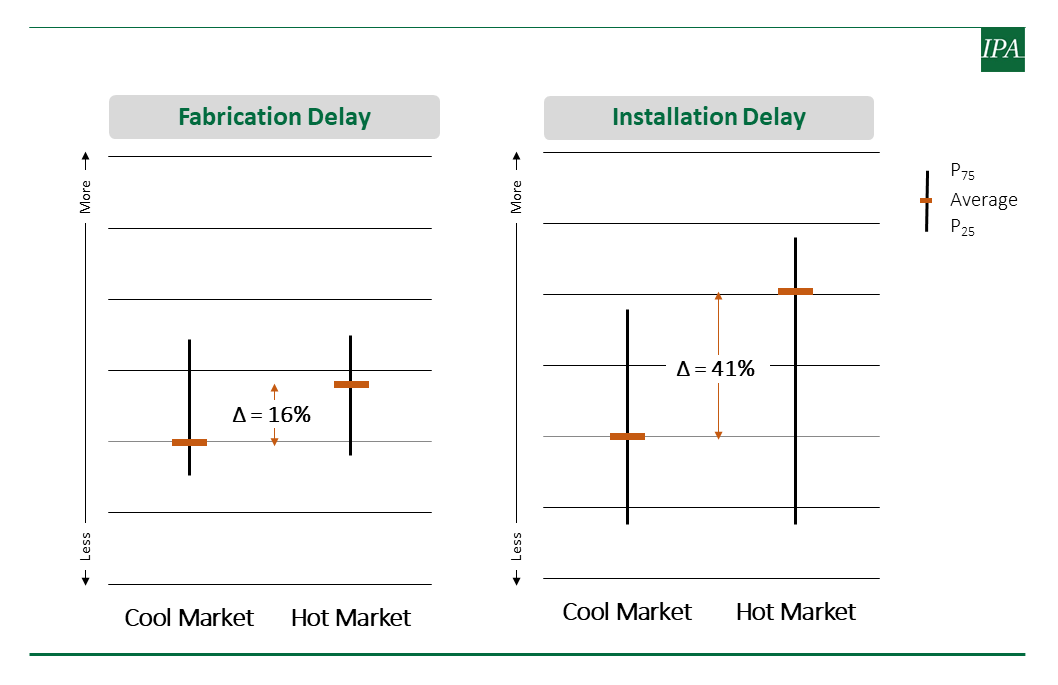
Leveraging some learnings from another analog, offshore fixed platforms, the figure below shows fabrication and installation delays between the hot and cold markets.6 Both fabrication and installation experienced significant delays during the hot market periods, but where fabrication only deviates by about 16 percent from the target, installation slips an average of over 40 percent. The average is skewed by several outliers, but that is part of the story. The variability between the two periods is massive, and most projects in the hot market period slipped their installation targets.
Masters of Supply Chain
Fortunately, it is not all doom and gloom. From what our oil and gas peers have shown us, harmony can be achieved between the owner operator and the supply chain. However, it takes some forward thinking and a mindset that the suppliers are partners, not just vendors and contractors.
Between the hot market periods of 2005 to 2014 (ignoring the short financial crisis excursion in 2009), most players in the energy sector, particularly oil and gas, experienced significant cost escalation and schedule delays, but not everyone. Two players in oil and gas—two very different players—leveraged similar strategies that kept cost and durations down. In its simplest form, you could call it standardization, but it really was a lot more than that.
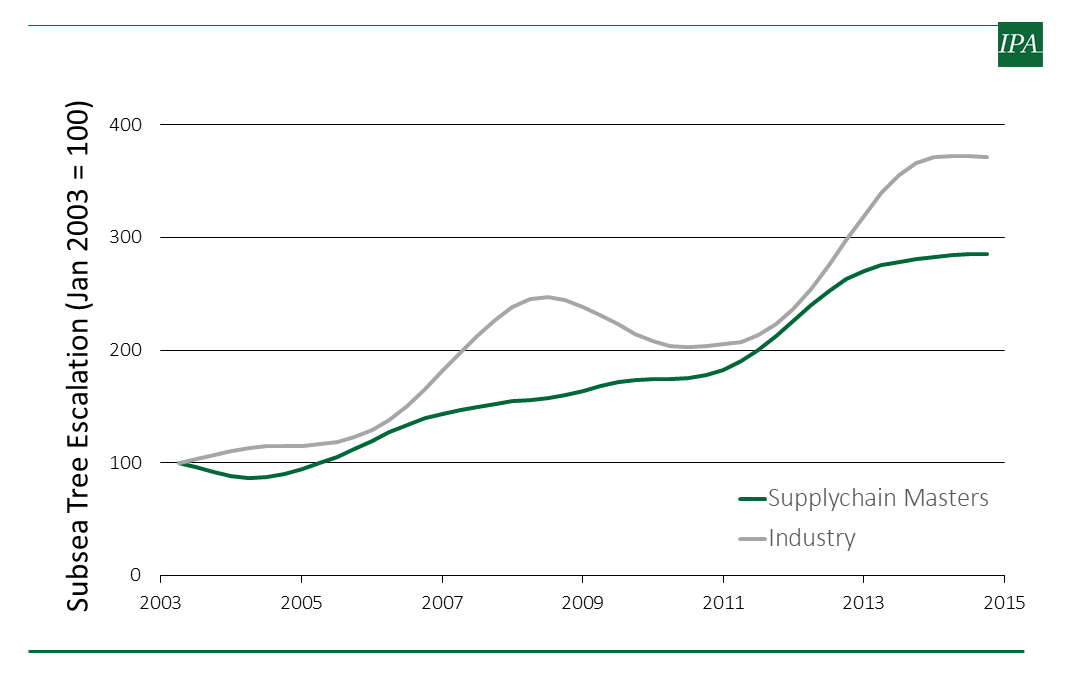
Using the subsea analog again, a big part of the price escalation (in addition to demand) was driven by owner specifications. Owners were systematically telling the original equipment manufacturers (OEMs) how to fabricate. The two successful companies took a different approach. They worked with the OEMs to identify equipment that would meet their needs and they ran with it, installing hundreds of the same pieces of equipment over and over again. The figure below shows a time trend of subsea tree escalation costs and compares the industry (full sample of owners) against the two companies using standardized equipment. As shown in the figure below, the companies employing standardization had systematically lower escalation than Industry (which includes them) for this specialized equipment.[7]
This same philosophy was extended throughout the supply chain and these owners were consistently completing projects faster and cheaper than their peers for well over a decade. They worked with the same vendors and suppliers on every job and built relationships on trust and openness, all to the mutual benefit of everyone involved. We have seen this model used effectively across a variety of offshore project types and believe that offshore wind is perfectly suited to implement this style of project development.
Follow the Data
Of course, analogs have limits, so IPA will be watching closely (through data) as this market continues to develop. Ultimately, although it may cost us a little more than we hoped, the world is putting in a significant amount of renewable energy with these windfarms, which is a big step in the right direction and long overdue.
If you are interested in learning more about the information shared in this short article, please reach out. IPA is first and foremost a data-based company—our insight is a combination of access to real project data provided to us by the world’s best and over 30 years’ experience learning through that data about what makes projects tick.
Please complete the form below if you would like to learn more about IPA’s capabilities within the offshore wind sector.
[1] Source: IPA Offshore Database. IPA collects spread rates and vessel data from project teams as part of our standard project evaluation process. The trend line is normalized for vessel class and region.
[2] Source: IPA Offshore Database. IPA collects information on subsea kits from project teams as part of our standard project evaluation process. The trend line for subsea hardware is normalized for functionality (pressure, fluid characteristics, etc.). The onshore construction trend is a composite index made up of a typical mix of input cost time series for commodity bulks, engineered equipment, labor rates, etc. Input costs are collected by IPA for each project we evaluate.
[3] Musial, Beiter, Spitsen, Nunemaker, Gevorgian, Cooperman, Hammond, and Shields, 2019 Offshore Wind Technology Data Update, National Renewable Energy Laboratory, October 2020.
[4] Data source: 4C Offshore Global Offshore Wind Farm Database.
[5] Data source: 4C Offshore Global Offshore Wind Farm Database.
[6] Source: IPA Offshore Database.
[7] Source: IPA Offshore Database.